

A financial analysis report is a structured document that evaluates a company’s financial performance using key metrics such as revenue, expenses, profitability, and liquidity. Businesses, investors, and stakeholders rely on these reports to assess financial stability.
The accounting services market is forecasted to grow at a 6.2% CAGR, reaching $735 billion by 2025. This rise highlights the growing need for financial analysis solutions. Businesses are increasingly leveraging data-driven tools to optimize financial management.
However, manual financial reporting can be time-consuming and prone to errors, leading to inaccurate insights and poor decision-making. This is where HashMicro Accounting Software provides a reliable solution.
In this article, we will explore the definition of financial analysis reports, their key benefits, and a step-by-step guide on how to create them.
Table of Content:
Table of Content

Key Takeaways
|
What is a Financial Analysis Report
Financial analysis reporting is the process of evaluating a company’s financial data to assess performance, profitability, and stability. It involves analyzing financial statements, ratios, and trends to generate insights that support strategic decision-making and business growth.
The main purpose of a financial analysis report is to present an accurate picture of an organization’s financial performance over a specific period. These reports are commonly used for investment evaluations, risk assessments, and business planning.
A well-prepared report enables businesses to identify strengths, weaknesses, and opportunities, ensuring more effective financial management and resource allocation.
Financial analysis reports typically include key components such as income statements, balance sheets, cash flow statements, and financial ratios. These elements provide a clear understanding of a company’s revenue streams, debt levels, and overall financial position.
Benefits of A Financial Analysis Report
A financial analysis report provides businesses with valuable insights into their financial health, enabling them to make data-driven decisions. Here are some of the main benefits of using a financial analysis report:
1. Improved decision-making
A financial analysis report helps businesses assess their current financial position and make informed strategic decisions. By analyzing financial statements and performance trends, companies can plan future investments, cost reductions, and revenue growth strategies effectively.
2. Risk identification and management
With a detailed financial analysis, businesses can identify potential financial risks, such as cash flow shortages, high debt levels, or declining profitability. Early detection of these risks allows companies to implement corrective actions and strengthen financial stability.
3. Enhanced profitability and cost efficiency
By tracking revenue, expenses, and profit margins, financial analysis reports help businesses identify cost-saving opportunities and areas where profitability can be improved. This ensures that resources are allocated efficiently, leading to better financial performance.
4. Stronger investor and stakeholder confidence
Investors and stakeholders rely on financial analysis reports to evaluate a company’s financial health before making investment decisions. A well-structured report enhances transparency and credibility, making it easier to attract investments and build trust with stakeholders.
4. Regulatory compliance and financial transparency
Many industries require businesses to comply with financial reporting regulations. A financial analysis report ensures accuracy and transparency, helping companies meet regulatory requirements and avoid legal complications.
By utilizing financial analysis reports, businesses can optimize financial planning, reduce risks, and enhance overall profitability.
How to Analyze Financial Analysis Report

Analyzing a financial analysis report involves evaluating key financial data to assess a company’s performance, profitability, and stability.
By examining financial statements, ratios, and trends, businesses can make informed decisions and improve financial management. Here are the key steps to effectively analyze a finance report:
1. Review the income statement
Start by analyzing the income statement, which provides insights into a company’s revenue, expenses, and profitability. Look at trends in sales growth, operating costs, and net profit to determine financial health and operational efficiency.
2. Examine the balance sheet
The balance sheet reveals a company’s assets, liabilities, and equity. Compare current and previous periods to assess liquidity, debt levels, and overall financial stability. High liabilities compared to assets may indicate financial risks that need attention.
3. Analyze the cash flow statement
The cash flow statement tracks cash inflows and outflows, showing how effectively a business manages its cash. A positive cash flow indicates strong financial health, while consistent negative cash flow may signal operational or investment issues.
4. Calculate financial ratios
Use financial ratios to evaluate a company’s performance. Key ratios include:
- Liquidity Ratios (e.g., current ratio) to assess short-term financial stability.
- Profitability Ratios (e.g., net profit margin) to measure profitability efficiency.
- Leverage Ratios (e.g., debt-to-equity) to determine financial risk levels.
5. Compare with Industry benchmarks
Comparing financial data with industry standards helps assess whether a company is performing above or below average. This provides context for evaluating financial health and competitiveness.
6. Identify trends and make projections
Analyzing financial trends over time helps businesses predict future performance and plan strategic actions. Identifying patterns in revenue growth, expenses, and profitability ensures better financial planning.
By following these steps, businesses can gain valuable insights into their financial status and make data-driven decisions for long-term stability and growth.
Types of Financial Statements
Financial statements are essential documents that provide a comprehensive overview of a company’s financial health. These statements help businesses, investors, and stakeholders assess profitability, liquidity, and overall financial stability. There are four main types of financial statements, each serving a distinct purpose:
1. Income statement
Also known as the profit and loss statement, the income statement shows a company’s revenue, expenses, and net profit over a specific period.
It helps businesses evaluate financial performance, identify cost structures, and determine profitability trends. Key components include revenue, cost of goods sold (COGS), operating expenses, and net income.
Financial statement analysis helps businesses assess profitability and financial trends. Two key methods are commonly used to interpret financial data effectively:
Vertical analysis
This method examines each line item as a percentage of total revenue, providing insights into cost structures, profit margins, and expense distributions. It helps businesses identify areas where costs may be too high or profit margins can be improved.
Here is a financial report example of how vertical analysis can be applied in evaluating financial efficiency.
vertical analysis financial report
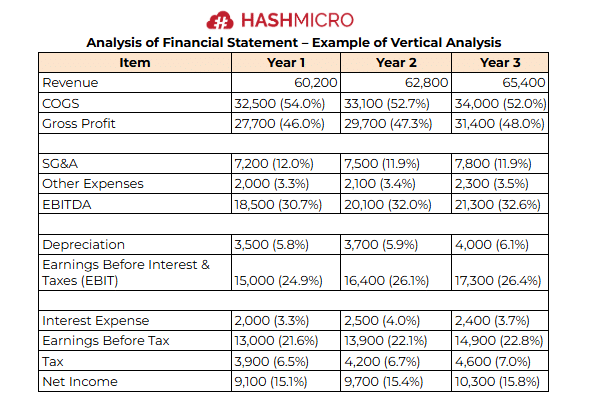
The vertical analysis shows a declining COGS percentage, improving gross profit margins, and stable SG&A expenses. EBITDA and EBIT margins increase, indicating stronger operations, while net income remains steady despite fluctuating interest expenses.
Horizontal analysis
This approach compares financial data over multiple periods to track growth trends, performance improvements, or declines. It highlights percentage changes in revenue, expenses, and profits over time.
Here is an example of how horizontal analysis can help assess financial performance over multiple periods.
horizontal analysis financial report
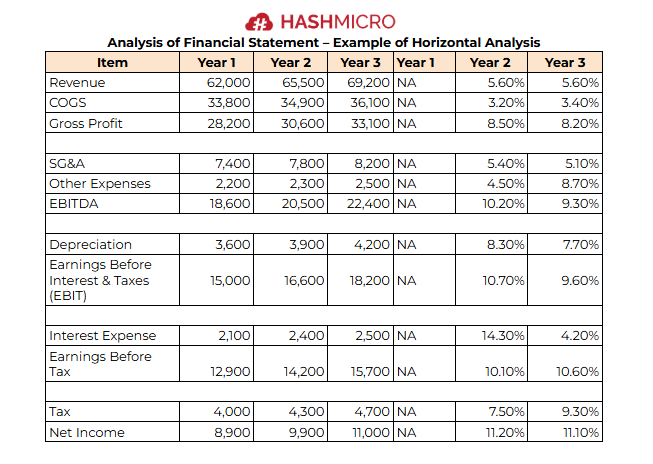
By applying both vertical and horizontal analysis, businesses can gain a comprehensive understanding of their financial performance, allowing them to identify strengths, address inefficiencies, and make more informed strategic decisions.
2. Balance sheet
The balance sheet provides a snapshot of a company’s financial position at a given time. It lists assets, liabilities, and shareholder equity and shows how resources are financed.
The balance sheet follows the equation: Assets = Liabilities + Equity, helping businesses assess liquidity, debt levels, and overall financial stability.
3. Cash flow statement
This statement tracks the movement of cash within a business, categorized into operating, investing, and financing activities. It helps companies understand their cash position, ensuring they have enough liquidity to cover expenses, invest in growth, and manage debt.
A positive cash flow indicates strong financial management, while a negative cash flow may signal financial challenges.
This report provides insight into how a business generates and spends its cash across operating, investing, and financing activities. Below is an example of a cash flow statement analysis:
cash flow statement analysis
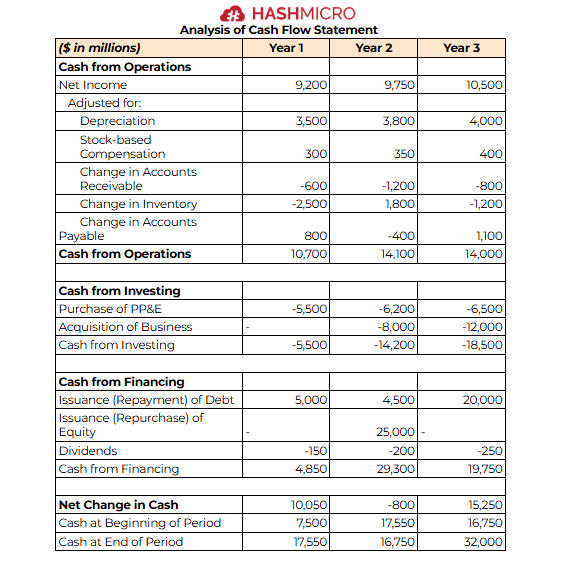
The cash flow statement reveals a strong cash generation from operations, particularly in Year 2 and Year 3, despite some fluctuations in working capital. Cash from investing activities shows significant capital expenditures, mainly due to acquisitions.
The financing section highlights debt issuance in Year 3, contributing to a significant cash inflow. However, the company also maintains dividend payments, ensuring shareholder returns.
4. Statement of changes in equity
Also known as the statement of retained earnings, this document details changes in a company’s equity over a period. It includes profits retained, dividend distributions, and additional investments by shareholders.
This statement helps investors understand how a company manages its earnings and reinvests profits for future growth.
Each financial performance format plays a crucial role in financial analysis, helping businesses make informed decisions and maintain financial stability.
How To Write A Financial Analysis Report
A financial analysis report provides a structured evaluation of a company’s financial health, performance, and risks. It helps businesses, investors, and stakeholders make informed decisions. To create an effective report, follow these key steps:
1. Write a clear company overview and business profile
Introduce the company by detailing its history, industry, business model, and financial objectives. Summarize key information such as revenue streams, market position, and competitive landscape to provide context for the analysis.
2. Analyze and summarize financial statements
Examine the income statement, balance sheet, and cash flow statement to assess profitability, asset management, and liquidity. Identify key financial trends over time and compare them with industry benchmarks to determine financial stability.
3. Determine sales forecast and revenue projections
Provide data-driven revenue projections based on past performance, market trends, and business strategies. Identify potential risks and opportunities that may impact future financial growth, ensuring a comprehensive forecast.
4. Evaluate profitability, liquidity, and solvency metrics
Assess financial stability using key metrics such as net profit margin, current ratio, and debt-to-equity ratio. Compare these metrics to industry standards to determine whether the company is financially sustainable in the long run.
5. Identify and assess financial risks
Identify financial risks such as market fluctuations, operational inefficiencies, and regulatory compliance issues. Analyze their potential impact and propose mitigation strategies to strengthen financial resilience.
6. Summarize findings and write actionable recommendations
Conclude with a well-structured summary of financial performance, highlighting key insights and trends. Provide strategic recommendations for improvement, such as cost optimizations, investment strategies, or operational enhancements.
By following these steps, businesses can write a well-structured financial analysis report that provides clarity and actionable insights for better decision-making.
You can also read other articles related to the best accounting software to optimize your business finances to find the solution that best fits your needs.
Enhance Your Financial Reporting with HashMicro Accounting Software
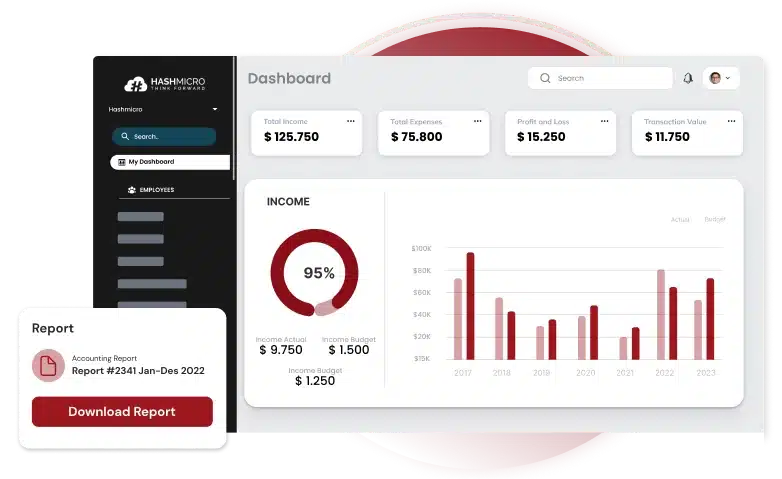
Accurate and efficient financial reporting is essential for businesses to track performance, maintain compliance, and make strategic decisions. HashMicro Accounting Software offers a comprehensive solution to streamline financial reporting with automation, real-time insights, and advanced analytics.
HashMicro’s automation eliminates manual data entry, reduces errors, and ensures accurate reports. It provides real-time financial insights and seamless integration. Automated reporting simplifies balance sheets, income statements, and cash flow.
Here are the key features of HashMicro Accounting System:
- Bank Integration – Auto Reconciliation: Automates bank transaction imports and reconciliations, reducing manual effort and errors.
- Multi-Level Analytical: Provides in-depth financial insights with multi-dimensional data analysis for better decision-making.
- Cash Flow Reports: Tracks inflows and outflows in real time to ensure optimal liquidity management.
- Forecast Budget: Predicts future financial needs based on historical data and business trends.
- Profit & Loss vs. Budget & Forecast: Compares actual performance against planned budgets for financial accuracy.
- Financial Statement with Budget Comparison: Aligns financial reports with budgeted figures to monitor variances and optimize spending.
Conclusions
A financial analysis report is a crucial tool for evaluating a company’s financial health, identifying trends, and making informed business decisions. It provides a structured overview of financial performance, helping businesses assess profitability, risks, and growth potential.
Accurate and timely financial analysis is essential for maintaining stability, optimizing budgets, and ensuring compliance. Without the right tools, managing financial data can be complex and prone to errors, leading to poor decision-making.
HashMicro Accounting Software simplifies financial reporting with automation, real-time insights, and advanced analytics. Its AI-powered features ensure accuracy, efficiency, and seamless integration, allowing businesses to generate detailed financial reports effortlessly.
Take control of your financial reporting today—book a free demo with HashMicro and experience smarter, automated financial management.

FAQ About Financial Analysis Report
-
What is an example of a financial reporting analysis?
An example of financial reporting is a company’s annual report, which usually contains the balance sheet, income statement, and cash flow statement. This report is often shared with the public, regulatory authorities, and creditors.
-
What are the 3 basic requirements of financial analysis?
Financial accounting requires companies to prepare a balance sheet, income statement, and cash flow statement, which serve as the foundation for financial analysis. Analysts commonly use horizontal, vertical, and ratio analysis to evaluate these statements.
-
What is financial reporting format?
No matter the format, financial reports always include detailed information on an organization’s revenues, expenses, profits, capital, cash flow, and other financial metrics to track historical performance, identify key areas of improvement, and create forecasts of potential future performance.