

Managing a construction project without a proper timeline can quickly lead to confusion and missed deadlines. A Gantt chart serves as an indispensable tool that provides a visual roadmap for all activities, making it easier to track progress and coordinate teams.
However, many construction managers face challenges such as inaccurate data, unrealistic timelines, and frequent updates, which can make Gantt charts difficult to maintain. These issues often lead to delays, cost overruns, and miscommunication among stakeholders.
In the Philippines, construction projects using Gantt charts have seen improvements in project scheduling and resource allocation. According to a study by the Philippine Institute of Civil Engineers (PICE), Gantt charts have helped streamline complex tasks and improved project delivery times.
To tackle these challenges effectively, it’s important to explore how a robust software solution can enhance your use of Gantt charts in construction projects. Keep reading to discover how automation and software can streamline your project management and boost efficiency.
Table of Contents

Key Takeaways
|
What is a Gantt Chart?
A Gantt chart is a vital project management tool that helps project managers visually schedule and organize tasks within a construction project. It outlines the order of tasks, their deadlines, durations, and dependencies, allowing for better time and resource management.
Typically, a Gantt chart consists of a task list on the left side and a project timeline on the right, with task bars representing each activity’s duration. This visual representation allows teams to track progress, allocate resources, and manage costs effectively throughout the project’s lifecycle.
Gantt charts are essential for managing construction projects. They offer clear insights into task sequencing, budgeting, and progress monitoring. By updating and displaying the chart on job sites, stakeholders remain informed, ensuring the project stays on track and within budget.
Components of a Gantt Chart

A Gantt chart is a powerful tool in construction project management. When integrated with construction project management software, it provides a clear visual representation of how a project is progressing. By breaking down the project into its key components, a Gantt chart helps teams stay on track and ensures that everyone is aligned with the project’s objectives.
Now, let’s explore the key components that make up a construction Gantt chart:
- Activities: Each vertical bar in a Gantt chart represents a specific task or activity within the project. These tasks are typically derived from the Work Breakdown Structure (WBS) and help define the project scope.
- Timeline: The horizontal axis on a Gantt chart represents time, broken down into days, weeks, or months. The scale of the timeline depends on the project’s size and whether the chart is for the entire project or a specific segment.
- Duration: The duration of each activity is shown by the length of its corresponding bar, stretching from the start to the finish date. This visually represents how long each task will take and when it is scheduled to be completed.
- Dependencies and predecessors: Arrows or lines connect bars, indicating the dependencies between tasks. These visual links show the relationship between tasks, clarifying which activities need to be completed before others can start.
- Milestones: Milestones represent significant points in the project, such as the completion of major phases. Often marked with diamond shapes, these key milestones help track the project’s progress and serve as important project markers.
The Value of Gantt Charts

Gantt charts serve as a visual representation of project timelines, making it easier for managers and teams to track progress, manage resources, and ensure timely completion. By effectively integrating Gantt charts into the project management process, construction teams can stay organized and proactive, minimizing delays and maximizing productivity.
- Monitor progress: A Gantt chart is an essential tool for tracking a project’s progress. By regularly updating the chart, project managers can compare actual progress against scheduled milestones, allowing them to identify potential delays and adjust the plan accordingly.
- Identify task dependencies and concurrencies: Gantt charts visually represent task dependencies, helping teams understand which activities must be completed before others begin. This clarity ensures smoother scheduling and resource allocation and enables the identification of tasks that can run concurrently to optimize time.
- Build and manage a budget: By aligning tasks with timelines, Gantt charts help project managers estimate and track costs efficiently. These charts can include cost data, allowing businesses to manage and adjust budgets based on task progress and changing needs.
- Improve communication: Gantt charts foster clear communication among all project stakeholders, including subcontractors and owners. Displaying the chart on-site or sharing it digitally ensures that everyone is informed of the project’s status and their role in its completion.
- Plan short-term and long-term: Gantt charts provide an excellent overview of both long-term project goals and short-term tasks. By breaking down the entire project and its phases, project managers can effectively prepare for upcoming tasks, ensuring smooth execution and timely completion.

Creating a Gantt Chart

Creating a Gantt chart for a construction project is a crucial step in organizing and managing timelines, tasks, and resources. It helps visualize the entire project, ensuring all activities are completed on time and within budget. By using the right software, you can streamline this process, ensuring a smooth project flow and better decision-making across teams.
1. Choose the right software
Creating a Gantt chart starts with selecting the right software for your needs. Popular tools like Microsoft Project and Primavera 6 offer robust features for designing detailed Gantt charts. These tools are often integrated with construction management systems, enhancing overall project coordination. Choosing a suitable platform ensures seamless integration and efficient project tracking.
2. Import project activities
Once the software is chosen, the next step is to import your project activities. Most Gantt chart tools allow you to input tasks, milestones, and timelines quickly. This process simplifies the creation of a visual project timeline, ensuring that every activity is accounted for. Correctly importing activities also allows for real-time updates as the project progresses.
3. Generate the Gantt chart automatically
After importing the tasks, the software generates the Gantt chart automatically. This chart visually maps out each task, showing start and end dates along the project timeline. It also helps project managers see potential overlaps or delays in the workflow. Automatic chart generation saves valuable time and ensures accuracy in scheduling.
4. Share and integrate with other tools
Sharing and integrating the Gantt chart with other project management tools is crucial for effective communication. These tools enable project teams and stakeholders to stay updated on progress in real-time. Integration allows for synchronization with other project-related tools, improving collaboration. Smooth communication across teams is essential for meeting deadlines and mitigating risks.
5. Monitor progress and make data-driven decisions
A key feature of Gantt charts is their ability to monitor progress in real-time. Project managers can make data-driven decisions based on the updates provided by the chart. With clear visual timelines, stakeholders can easily assess the status of various tasks and ensure that everything is on track. This continuous monitoring helps keep the project moving forward efficiently and avoids costly delays.
With the help of all-in-one platforms like HashMicro Construction Software, creating, sharing, and managing Gantt charts becomes more efficient. This tool centralizes all your project information, enabling better collaboration and decision-making, ensuring your construction project stays on schedule and within budget.
How Gantt Charts Help Inform Other Planning Methods

Gantt charts are essential tools in construction project management. They help teams visualize the project schedule and track progress. They can be integrated with various planning methods to enhance decision-making and ensure smooth project execution.
In this section, we’ll explore how Gantt charts complement other methods, such as Building Information Modeling (BIM) and the Critical Path Method (CPM), to improve overall project planning and delivery.
1. Building Information Modeling (BIM)
Building Information Modeling (BIM) creates detailed 3D models of construction projects, allowing teams to visualize and plan effectively. By integrating Gantt chart schedule data into BIM, the project becomes a 4D model, with each object linked to specific tasks and timelines.
This combination helps to identify potential problems early, enhance coordination and reduce costly delays. When combined with a Gantt chart, BIM offers a more dynamic and comprehensive planning tool that helps teams manage time and resources efficiently.
2. Critical Path Method (CPM)
The Critical Path Method (CPM) identifies the most essential tasks that determine a project’s completion date, ensuring everything runs on schedule. While CPM typically uses nodes and arrows to represent task sequences, Gantt charts offer an alternative by visually displaying these tasks with bars and arrows.
Gantt charts can effectively illustrate the critical path by highlighting key tasks, making it easier for teams to focus on what is necessary for timely project completion. Using a Gantt chart alongside CPM improves clarity and helps manage the project’s critical elements efficiently.
Gantt Charts Best Practices

To maximize the effectiveness of your Gantt chart, follow some best practices that enhance its usability and help you stay on top of your construction project.
1. Create a work breakdown schedule
A Work Breakdown Structure (WBS) is a technique that breaks down a complex project into smaller, manageable tasks. These tasks become the foundation for your Gantt chart, allowing you to visualize the project in smaller, more actionable segments.
By organizing work in this way, you ensure every critical aspect of the project is accounted for. Creating a WBS gives you a clear roadmap, enabling you to track progress and make informed decisions more efficiently.
2. Regularly update and monitor
A Gantt chart is only useful if it is kept up-to-date, and this should be done regularly, even on a daily basis. Displaying the most current version at job sites allows stakeholders to reference the chart and make data-driven decisions.
This practice ensures everyone involved is on the same page and allows for quick identification of any issues. Regular updates help prevent delays and maintain the project’s momentum by keeping all team members aligned with real-time information.
3. Identify float time
Unexpected delays, such as bad weather or supply chain issues, can impact project timelines, making it essential to identify float time in your Gantt chart. Float time gives you the flexibility to accommodate setbacks without derailing the entire production schedule.
By building in buffer periods, you create a cushion that can help absorb disruptions. This proactive approach helps reduce stress during construction and ensures that the project remains on track even when challenges arise.
Streamline Your Gantt Chart Management with HashMicro’s Project Management Software Solution
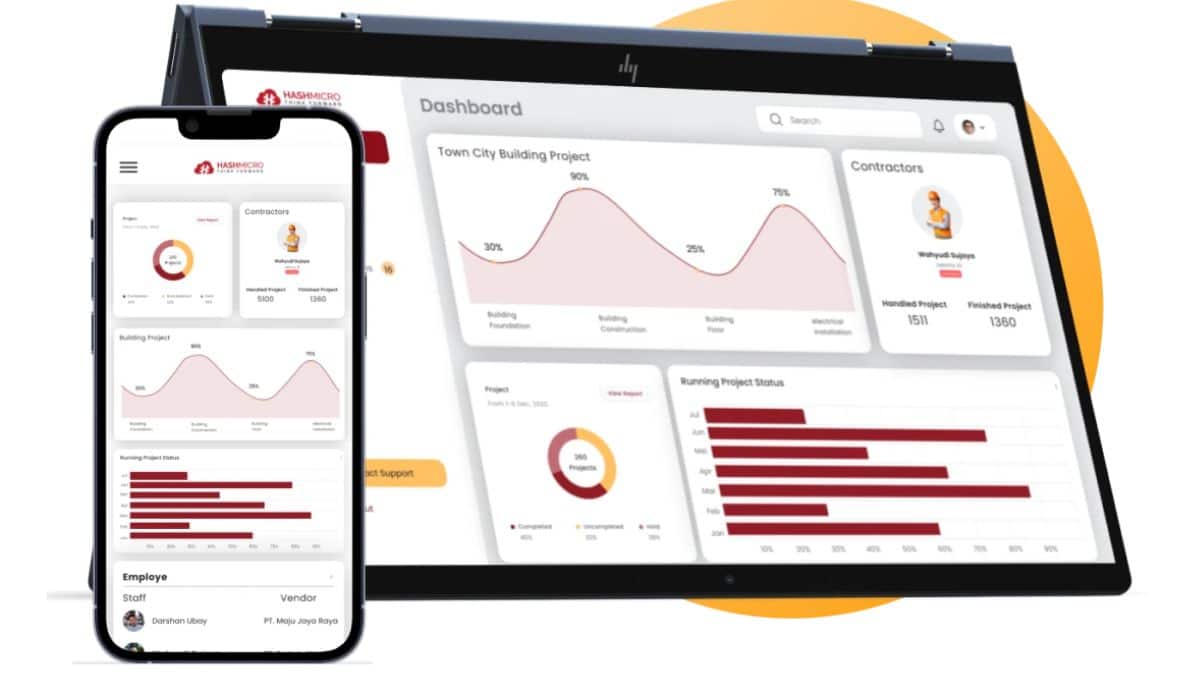
HashMicro offers a comprehensive construction software solution tailored to help businesses efficiently manage their Gantt charts. A standout feature is the automation of project scheduling and task tracking, ensuring that every aspect of your project’s timeline is accurately updated and managed with ease.
Experience the power of HashMicro’s construction software through a free demo. Discover how automation simplifies Gantt chart management, enhances project visibility, and ensures timely updates, minimizing delays and maximizing project efficiency.
Why choose HashMicro? Our construction software automates crucial Gantt chart management tasks, such as tracking project progress, adjusting timelines, and optimizing resource allocation, improving overall operational efficiency. Its seamless integration with other project management modules provides a unified solution for businesses looking to streamline construction project workflows.
Below are some of the key features of HashMicro’s construction software for Gantt chart management:
- S-Curve Plan vs Actual Project Cost – Visualize budget progress against actual spending for better cost management on the Gantt chart.
- S-Curve Plan vs. Actual Project Progress—Track project progress in real-time by comparing it to the original timeline, integrated with the Gantt chart.
- S-Curve Purchased/Transferred/Used Project Cost – Monitor material purchases, transfers, and usage against the project cost, allowing for detailed Gantt chart tracking.
- In-depth Budgeting Types (Material, Asset, Petty Cash, Overhead, Subcontractor) – Break down budget categories for clear representation on a project timeline.
- Progressive Invoice and Bill for Project (Monthly/Progress-Based) – Automate invoicing based on project milestones and include this in the Gantt chart for better cash flow monitoring.
- Variation Order on Subcontractor Contract – Track variations in subcontractor work and costs within the Gantt chart to ensure smooth workflow.
- Integrated with Accounting to Track P&L and Balance Sheet per Project – Seamlessly link budget tracking with financial reports, showing real-time project finances on the Gantt chart.
- Project Issue Management – Flag and track project issues directly on the Gantt chart to keep the team informed and aligned.
- In-depth Job Estimates (RAB), Contract, Cost Sheet (RAP) – Provide detailed estimates and cost sheets for each project phase, integrated with the project timeline.
- Automated Project Invoice Based on Progress or Month – Automatically generate invoices for work completed, linked to the project progress shown on the Gantt chart.
These capabilities improve project tracking, reduce errors, and optimize the project timeline. With HashMicro’s construction software, businesses can enhance their project management, improve scheduling accuracy, and ensure the timely completion of construction projects.
Conclusion
A Gantt chart in construction is an essential project management tool that helps visualize the timeline, task dependencies, and progress of a project. With the right construction software, businesses can automate scheduling, track real-time progress, and improve overall efficiency.
HashMicro’s construction software provides a comprehensive solution that integrates Gantt chart functionality, allowing businesses to manage projects effectively from start to finish. It enhances task management, resource allocation, and progress tracking, ensuring timely project delivery while maintaining high standards.
Ready to take your construction project management to the next level? Sign up for a free demo of HashMicro’s construction software today and experience how it can streamline your processes and drive business success.