


Inventory problems are not new for Filipino businesses. Unused stock piles up, items go unsold, and before you know it, they have expired or become unusable. That is money down the drain, and it sounds familiar, right? If you are in food manufacturing, this is a total nightmare. A study from PIDS even showed that the Philippines wastes around 2,000 tons of food every single day, much of it tied to poor stock visibility.
Based on so many problems caused by bad inventory management, this article will show you how important an inventory aging report is and the easiest way to do it from your home without so many steps.
Key Takeaways
|
Table of Contents
Understanding Inventory Aging Reports
An inventory aging report provides insights into inventory status, showing how long each item stays in storage before being sold or used. It categorizes inventory into time brackets (e.g., 0-30 days, 31-60 days, 61-90 days) based on how long items have been in the warehouse.
This report helps companies identify slow moving stock or outdated stock, so they can take actions, such as offering discounts or adjusting purchasing strategies to optimize inventory levels and reduce storage costs.
Furthermore, an inventory aging report supports businesses in maintaining optimal stock levels by providing insights into product demand trends. Regularly analyzing this aged report enables companies to adjust their inventory strategies, preventing overstocking or understocking issues.
Why Inventory Aging Reports Matter for Your Business
 Inventory aging reports offer multiple benefits that can greatly enhance your business operations. Here are some of the key benefits to explore:
- Identify slow moving inventory: The report highlights items that are not selling well, allowing you to take action, such as offering discounts or promotions.
- Sales and inventory mismatch: It reveals any gaps between your sales data and inventory, helping to pinpoint inefficiencies.
- Manage dead stock: The report aids in strategizing how to handle dead stock through bundling, clearance sales, or special promotions.
- Reduce carrying and overhead costs: By identifying excess stock, you can lower storage expenses and free up capital for other opportunities.
- Improve cash flow: Aging inventory can tie up liquidity, and reducing it allows for better financial flexibility and higher margins.
The Advantages and Disadvantages of Using an Inventory Aging Report
An inventory aging report is a critical tool for assessing the status of your stock. However, like any analytical resource, it presents benefits and potential drawbacks. Evaluating these advantages and disadvantages is essential to maximize its effectiveness in supporting your business operations.
Advantages:
- Evaluates how long products remain in inventory.
- Highlights the slow moving items that require attention.
- Enhances decision-making for future inventory purchases.
- Assesses the expenses involved in maintaining inventory quality.
Disadvantages:
- Provides limited visibility into overall inventory costs.
- Does not identify which products move the slowest through the inventory cycle.
- Lacks insight into which items incur the highest inventory related expenses.
- This may lead to increased costs for preserving inventory quality.
How to Calculate Aging Inventory
Understanding how to calculate aging inventory and implementing a periodic inventory system can help streamline stock management and improve business efficiency. Here are the keys to an inventory aging report calculation for creating a good inventory report:
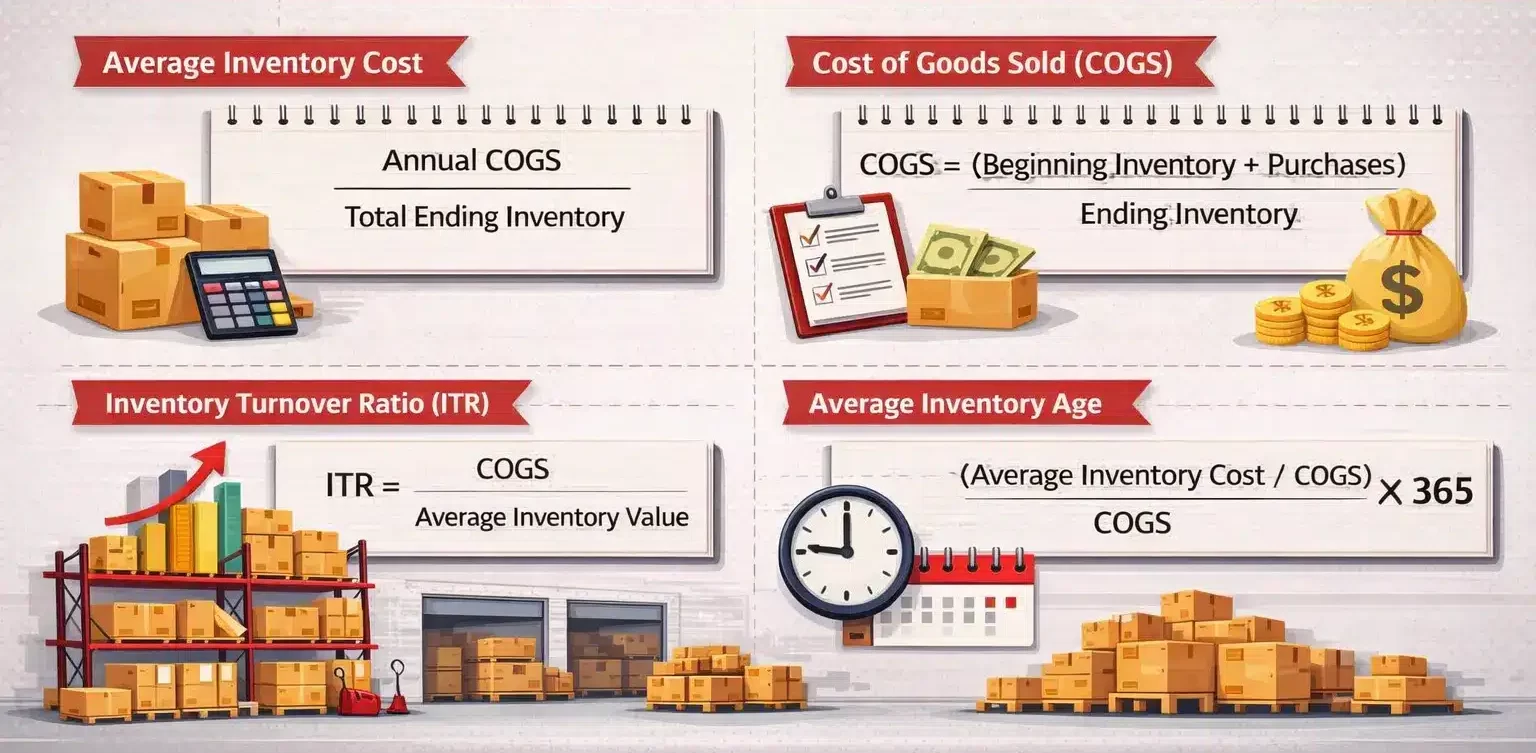
- Average inventory cost: This reflects the value of your inventory over a period, helping balance stock levels during seasonal changes. Formula: Average inventory cost = annual COGS / total ending inventory.
- Cost of Goods Sold (COGS): This represents the total cost of producing goods sold, including direct and indirect costs. Formula: COGS = (beginning inventory + purchases) – ending inventory.
- Inventory Turnover Ratio (ITR): The ITR indicates how often inventory is sold and replaced in a year. Formula: ITR = COGS / average inventory value.
- Average inventory age: This measures how long it takes to sell inventory. Formula: Average inventory age = (average inventory cost / COGS) x 365.
Inventory Aging Report Example or Calculation
Suppose your electronics store has an average inventory cost of ₱10,000,000, and your COGS is ₱30,000,000. Using the inventory aging report example, your average inventory age would be:
Average inventory age = (₱10,000,000 / ₱30,000,000) x 365 = approximately 122 days.
5 Key Performance Indicators for Inventory Aging
 Tracking the right KPIs is critical to managing inventory aging effectively. Here are five essential KPIs:
- Inventory turnover ratio: This measures how frequently inventory is sold and replaced, indicating efficient inventory management.
- Percentage of inventory aging: This shows the portion of your stock that has been sitting for too long.
- Carrying costs: These include storage, insurance, and employee expenses, which should be monitored to avoid excessive costs.
- Percentage of slow moving inventory: This metric helps track items that are selling slower than expected.
- Inventory carrying cost as a percentage of revenue: This KPI helps assess whether holding costs align with revenue generation.
Why Inventory Aging Reports Matter in Construction Projects
 In construction, inventory is directly tied to project timelines and budgets. Materials like cement, steel, and electrical components can degrade if stored too long. An inventory aging report helps track how long materials sit in storage, reducing waste and preventing duplicate purchases.
With better visibility, construction managers can align material orders with project schedules, improve cash flow, and avoid delays caused by expired or unusable stock.
Tips for Reducing Aging Inventory
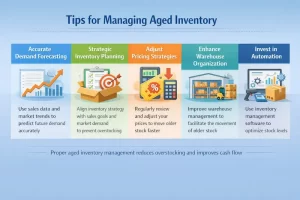 To ensure that your business doesn’t suffer from stockpiled, unsold items, follow these tips for managing aged report:
- Accurate demand forecasting: Use sales data and market trends to predict future demand accurately.
- Strategic inventory planning: Align your inventory strategy with sales goals and market demand to prevent overstocking.
- Adjust pricing strategies: Regularly review and adjust your prices to move older stock faster.
- Enhance warehouse organization: Improve warehouse management to facilitate the movement of older stock.
- Invest in automation: Use inventory management software to optimize stock levels and integrate with a barcode inventory system.
Conclusion
An inventory aging report is a vital tool for managing stock levels, reducing costs, and improving overall business efficiency. By providing insights into slow moving and aging inventory, it allows companies to make informed decisions on stock management, pricing strategies, and demand forecasting.
For businesses looking to apply these insights, reviewing available cloud inventory management software options can help identify the right solution for automating and maintaining these reports at scale.
FAQ About Inventory Aging
-
How do you write an aging report?
To create an aging report, review all unpaid invoices, categorize them by aging periods (e.g., 0-30 days, 31-60 days), and segment customers based on overdue amounts and days outstanding to compile the final report.
-
What are the 4 types of inventory?
The four categories of inventory include raw materials, work in progress (WIP), finished products, and maintenance, repair, and overhaul (MRO) inventory.
-
How to classify inventory?
In this analysis, inventory items are divided into three groups: Category A consists of 20% of the items that account for 80% of sales. Category B contains 30% of the items contributing 15% to sales. Category C includes the remaining 50% of items, contributing only 5% to sales.