






Stockouts and overstocking can stem from the same problem: treating every SKU as equally easy to replenish. SDE analysis addresses this by classifying items as Scarce, Difficult, or Easy based on procurement difficulty. According to the Philippines Department of Trade and Industry (DTI), data-driven supply chain tools can improve visibility across supply, demand, costs, and logistics performance.
This matters in the Philippines, where disruptions such as typhoons can affect port and maritime operations. By identifying which items are harder to source, SDE analysis helps teams determine where longer lead times, higher safety stock, or backup suppliers may be needed.
This guide walks through what SDE analysis is, how it differs from ABC analysis, why it matters for inventory management, a worked classification example, the steps to implement it, and the limitations to plan around. Keep reading to learn how this simple approach can help optimize your inventory management system and drive better results for your business!
Key Takeaways
Understanding SDE Analysis SDE analysis helps you categorize inventory into Scarce, Difficult, and Easy items for smarter management. This method makes procurement easier, cuts costs, and ensures you always have the right stock.
Optimizing Inventory Efficiency SDE analysis helps balance supply and demand so you can maintain the right stock levels. It prevents overstocking and stockouts saves money and keeps operations running smoothly.
SDE analysis helps businesses manage inventory better by classifying items, using data, applying the right tools, and continuously adjusting strategies to keep stock levels efficient and controlled.
What is SDE Analysis?

SDE (Scarce, Difficult, Easy) analysis categorizes inventory based on how easily items can be procured and managed. It helps businesses prioritize stock management, optimize costs, and ensure smooth operations.
By classifying items into Scarce, Difficult, and Easy categories, businesses can better understand demand and availability. This makes inventory management more efficient and cost-effective.
SDE Analysis vs. ABC Analysis: Key Differences
The difference is the question each method asks. ABC analysis asks how much does this item cost us, while SDE analysis asks how hard is this item to get. A cheap gasket with one overseas supplier is a C item under ABC and an S item under SDE and it is the S rating that will stop your production line.
| Differences | SDE Analysis | ABC Analysis |
|---|---|---|
| Classification basis | Procurement difficulty and availability | Annual consumption value |
| Categories | Scarce, Difficult, Easy | A (high value), B (medium), C (low) |
| Core question | Can we get this item when we need it? | How much of our inventory spend does this item represent? |
| Primary owner | Procurement and supply planning | Finance and inventory control |
| Best used for | Setting lead times, safety stock, and supplier strategy | Setting stock-count frequency and capital allocation |
| Typical output | Sourcing policy per category | Control tiers and cycle-count schedule |
| Main limitation | Ignores item value entirely | Ignores supply risk entirely |
Neither method replaces the other. Most mature inventory teams run both and cross-tabulate the results, so an item that is both A (expensive) and S (scarce) receives the tightest control in the warehouse.
Why SDE Analysis Is Important for Inventory Management?
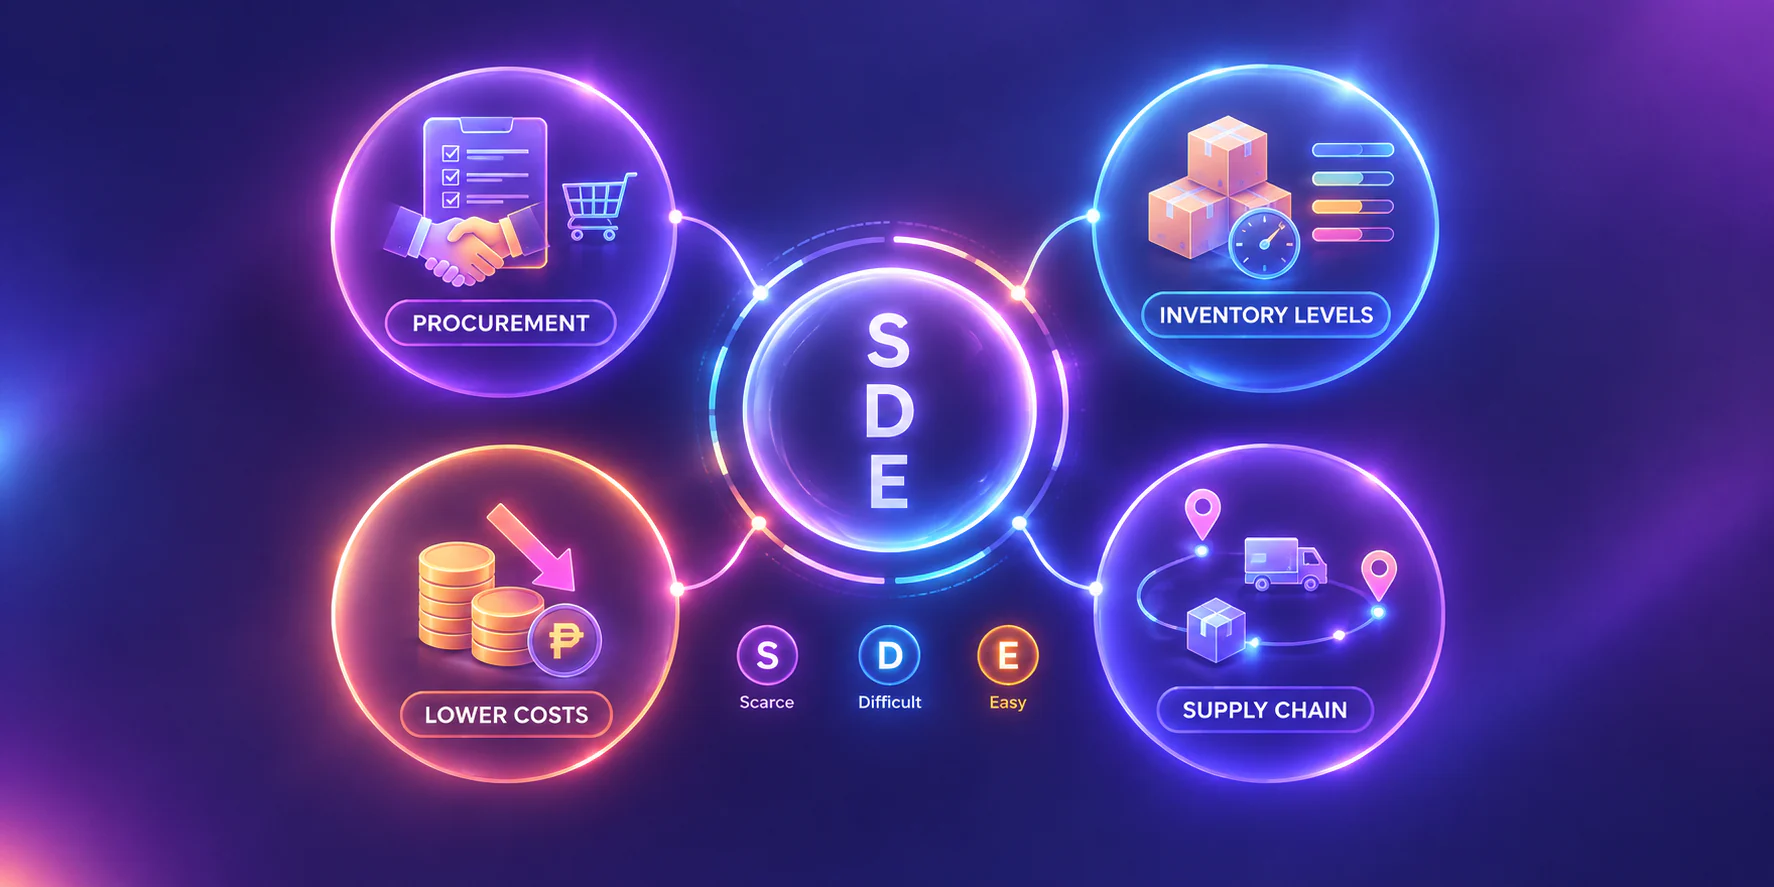
SDE analysis helps businesses streamline inventory management by categorizing items based on demand and availability. This leads to better stock control, cost efficiency, and improved customer satisfaction.
Without an availability-based classification, buyers apply the same reorder rhythm to items with wildly different risk profiles. SDE analysis corrects that by directing attention, budget, and buffer stock toward the items most likely to fail you.
1. Prioritizing Procurement Efforts
Buyers have finite hours, and spreading them evenly across thousands of SKUs means the riskiest items get the same five minutes as the safest ones. Classifying stock into S, D, and E lets procurement spend its time where a missed order actually stops operations, negotiating contracts and qualifying backup suppliers for Scarce items, while Easy items move to automated reordering. The result is fewer emergency purchases at premium prices.
2. Optimizing Inventory Levels
Safety stock is only useful when it sits on the right items. SDE analysis gives a defensible rule for setting it: deep buffers for Scarce items whose lead times swing by weeks, moderate buffers for Difficult items with handling or supplier reliability issues, and minimal buffers for Easy items that local vendors can replenish within days. This is how a warehouse avoids being simultaneously overstocked and out of stock.
3. Reducing Inventory Costs
Every peso tied up in slow-moving inventory sitting three months deep is a peso unavailable for the scarce items that genuinely need coverage. Rebalancing buffers along SDE lines can free working capital without raising stockout risk, while also reducing storage, handling, and obsolescence costs.
4. Enhancing Supply Chain Efficiency
SDE categories give the whole chain a shared language for urgency, so planning, purchasing, and the warehouse floor agree on which items justify expedited freight or a dedicated storage zone. Mapping categories to physical locations is where classification meets day-to-day execution, and it works best when your warehouse management practices already define zones, picking rules, and stock ownership clearly.
Taken together, these four effects shift inventory management from reactive firefighting to a policy your team can apply consistently.
SDE Analysis Example: Classifying Inventory In Practice
Consider a Manila-based electronics assembler holding roughly 1,200 SKUs. Instead of scoring every item at once, the planning team ranked each one on two inputs it already had in its records: supplier lead time and number of qualified suppliers.
| Item | Lead time | Qualified suppliers | SDE class | Policy applied |
|---|---|---|---|---|
| Imported microcontroller | 14–18 weeks | 1 (overseas) | Scarce | 16-week cover, quarterly forecast review, second source under qualification |
| Custom-moulded enclosure | 6–8 weeks | 2 (tooling-specific) | Scarce | 10-week cover, tooling contract with penalty clause |
| Lithium battery pack | 4–5 weeks | 3 | Difficult | 6-week cover, storage-temperature monitoring, supplier scorecard |
| Ribbon cable assembly | 3 weeks | 4 | Difficult | 4-week cover, quarterly supplier review |
| Standard screws and fasteners | 3–5 days | 8+ local | Easy | Automated reorder point, 2-week cover |
| Packaging cartons | 2–4 days | 6 local | Easy | Automated reorder point, 1-week cover |
Two patterns show up immediately in this kind of exercise. First, the Scarce group is small typically 5–10% of SKUs, but it absorbs most of the planning attention, which is exactly the intent. Second, several items the team assumed were critical turned out to be Easy, and their buffers were cut without any increase in shortage risk.
The classification is not permanent. A supplier exiting the market can move an item from Easy to Scarce in a single quarter, so the review cadence matters as much as the initial sort.
Steps to Implement SDE Analysis
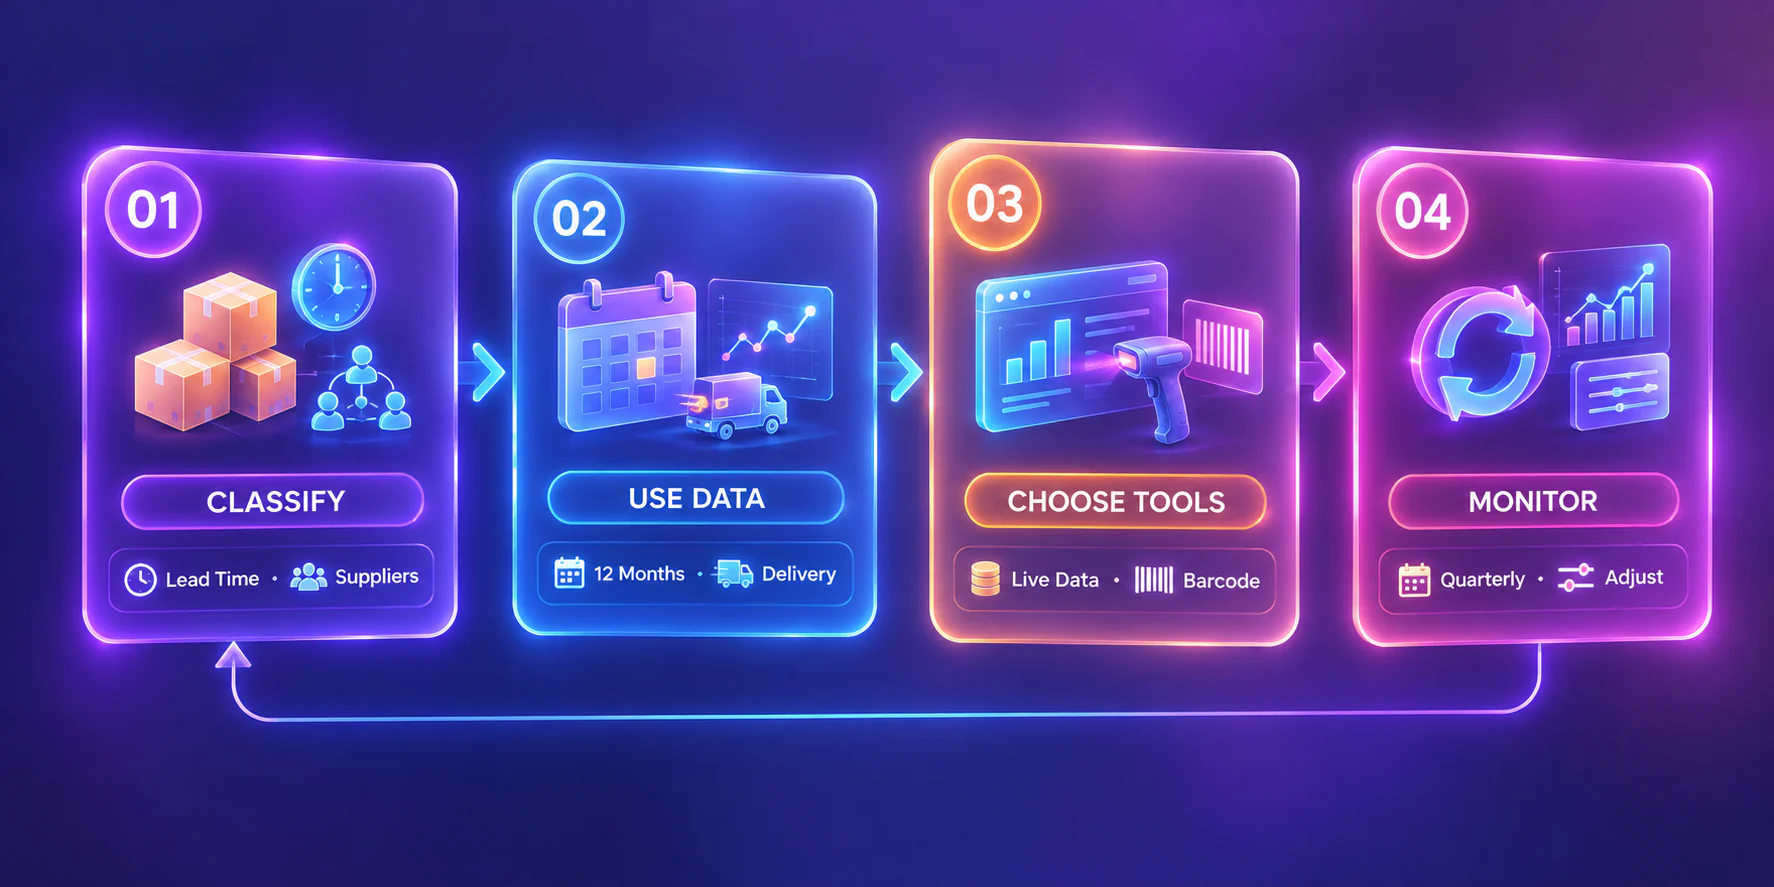
Implementing SDE analysis helps streamline inventory management and improve stock control. Here’s a simple process to get started:
1. Classify Your Inventory
Start with objective, already-available inputs rather than opinion: supplier lead time, number of qualified suppliers, and historical fill rate. Set explicit thresholds before you begin, for example, Scarce as lead time above 12 weeks or a single qualified supplier, so two planners classifying the same item reach the same answer.
2. Use Historical Data
Pull at least 12 months of purchase history so seasonality and one-off disruptions are visible rather than hidden in an average. Look specifically at the gap between promised and actual delivery dates, because a supplier who is consistently two weeks late effectively makes an item Difficult regardless of its quoted lead time.
3. Choose the Right Tools
Spreadsheets handle a first pass, but they go stale the moment lead times shift. Inventory management software that recalculates classifications from live receiving data keeps categories current, and it pairs naturally with a barcode inventory system that captures accurate receipt and issue timestamps at the point of movement without that data quality, the classification inherits every error in your manual records.
4. Monitor and Adjust
Review classifications quarterly at minimum, and immediately after any supplier loss, port disruption, or regulatory change affecting imports. Track how many items changed category each cycle: a high churn rate signals thresholds that are too tight, while zero movement usually means nobody is actually reviewing.
By following these steps and using the right tools, you can implement SDE analysis efficiently, optimizing your inventory management. This approach helps reduce waste, improve procurement, and keep your business running smoothly.
Overcoming Challenges in Implementing SDE
Inaccurate or inconsistent classification. When thresholds are vague, classification becomes a matter of who filled in the spreadsheet. Publish written criteria, have a second reviewer spot-check a sample each quarter, and log every category change with its reason so the rationale survives staff turnover.
Manual workload on Scarce and Difficult items. These categories demand the most monitoring and can quietly consume a buyer's entire week. Automate the routine parts using reliable inventory management platform, so human attention goes to negotiation and sourcing decisions rather than data entry.
The method ignores item value. SDE says nothing about cost, so used alone it can justify heavy buffers on cheap items. Cross-tabulate with ABC analysis and prioritize the A-S overlap first.
Classifications go stale. Supply conditions move faster than annual reviews. Tie the review cadence to supplier events rather than the calendar alone, and treat any disruption as a trigger to reclassify affected items.
Conclusion
SDE analysis gives inventory teams a defensible answer to a question ABC analysis cannot address: which items are most likely to be unavailable when the business needs them. By sorting stock into Scarce, Difficult, and Easy and matching safety stock, reorder policy, and supplier strategy to each category, businesses reduce both emergency purchasing and idle working capital and they do it with data they already have.
Keeping those classifications accurate is the hard part, because lead times and supplier reliability change faster than any spreadsheet is updated. HashMicro's Inventory Management System tracks receipts, lead-time variance, and supplier performance in real time, so your SDE categories reflect current supply conditions rather than last year's assumptions. Request a free consultation to see how it handles your SKU mix.

FAQ Around SDE Analysis
It is a method that categorizes inventory into Scarce, Difficult, and Easy items. It helps businesses prioritize stock management, optimize procurement, and ensure smoother operations for better efficiency and cost control.
This helps businesses streamline inventory management by classifying items based on availability and demand. It improves procurement decisions, reduces waste, and ensures the right items are always in stock to meet customer needs efficiently.
It is important for managing inventory efficiently and reducing stockouts and overstocking. It helps businesses prioritize critical items, save costs, and improve customer satisfaction by maintaining balanced stock levels.
Yes, and combining them is standard practice. ABC ranks items by consumption value while SDE ranks them by procurement difficulty, so cross-tabulating the two produces nine control groups. Items landing in the A-S cell — expensive and hard to source — receive the tightest monitoring, contracted supply, and highest safety stock.
SDE analysis ignores item value entirely, so it can justify large buffers on inexpensive stock. Classification also depends on subjective thresholds unless criteria are written down, and categories go stale when supplier conditions change. Pair it with ABC analysis and review classifications quarterly to offset both weaknesses.